"This is personal. This is my life."
Those words, scrawled on a yellow sticky note, changed how we approached the entire project. We weren't digitizing paperwork. We were designing for a moment of profound professional transformation.
The Breaking Away
Financial advisers who built their careers at large institutions eventually face a choice: stay comfortable, or strike out on their own. The ones who choose independence aren't naive—they know the road is hard. What they don't expect is that paperwork would be their biggest obstacle.
The onboarding process consumed 24 weeks on average. Every form was manual. Every data point re-entered across multiple systems. Compliance teams flagged 74% of submissions as "Not In Good Order"—regulatory jargon for "start over."
The cost wasn't just time. Delayed transitions meant delayed revenue. Clients sat in limbo, wondering if they'd made a mistake trusting their adviser's new venture. Advisers hemorrhaged credibility before their firms even launched.
74% rejection rate meant the system was designed to fail.
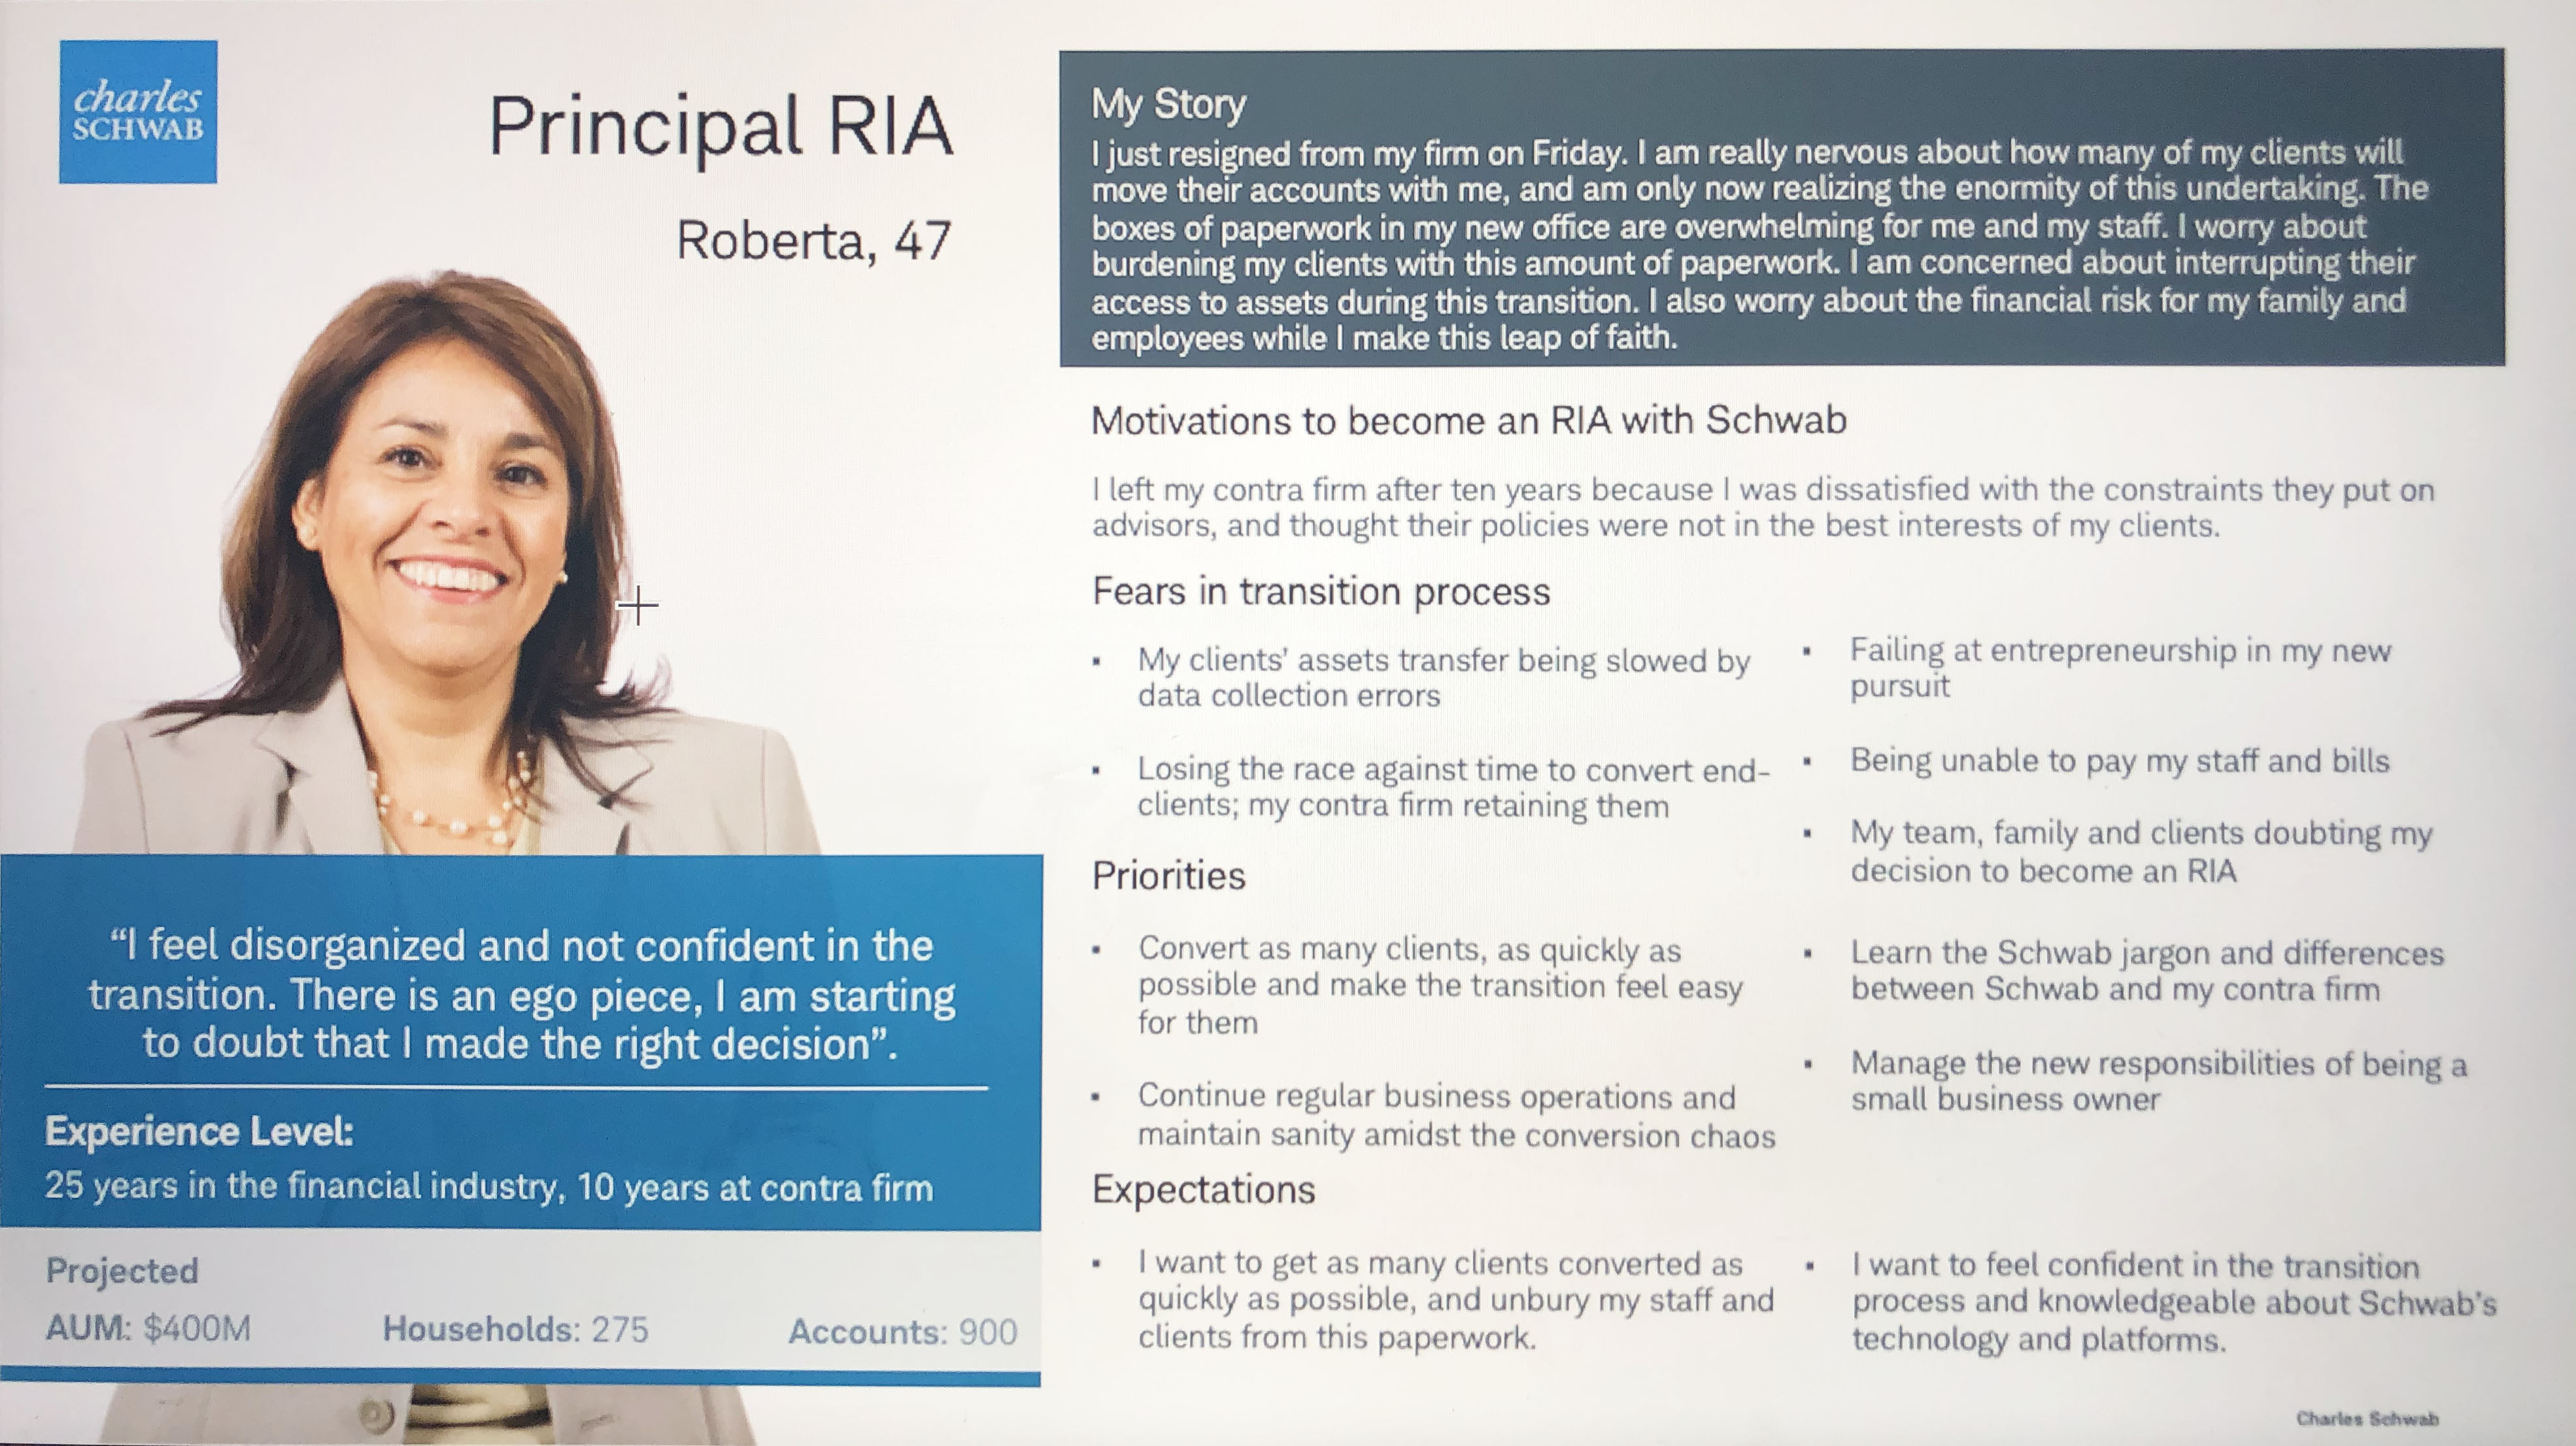
Understanding Roberta
We spent two months in research before touching a wireframe. Contextual inquiries with advisers mid-transition. Stakeholder sessions with compliance, operations, and technology teams. We mapped every handoff, every failure point, every workaround that had calcified into process.
From this emerged Roberta—not a fictional persona, but a composite of real struggles. Roberta had spent 18 years building her book of business. She knew her clients' kids' names, their retirement dreams, their fears about market volatility. Now she was drowning in forms that treated those relationships as rows in a spreadsheet.
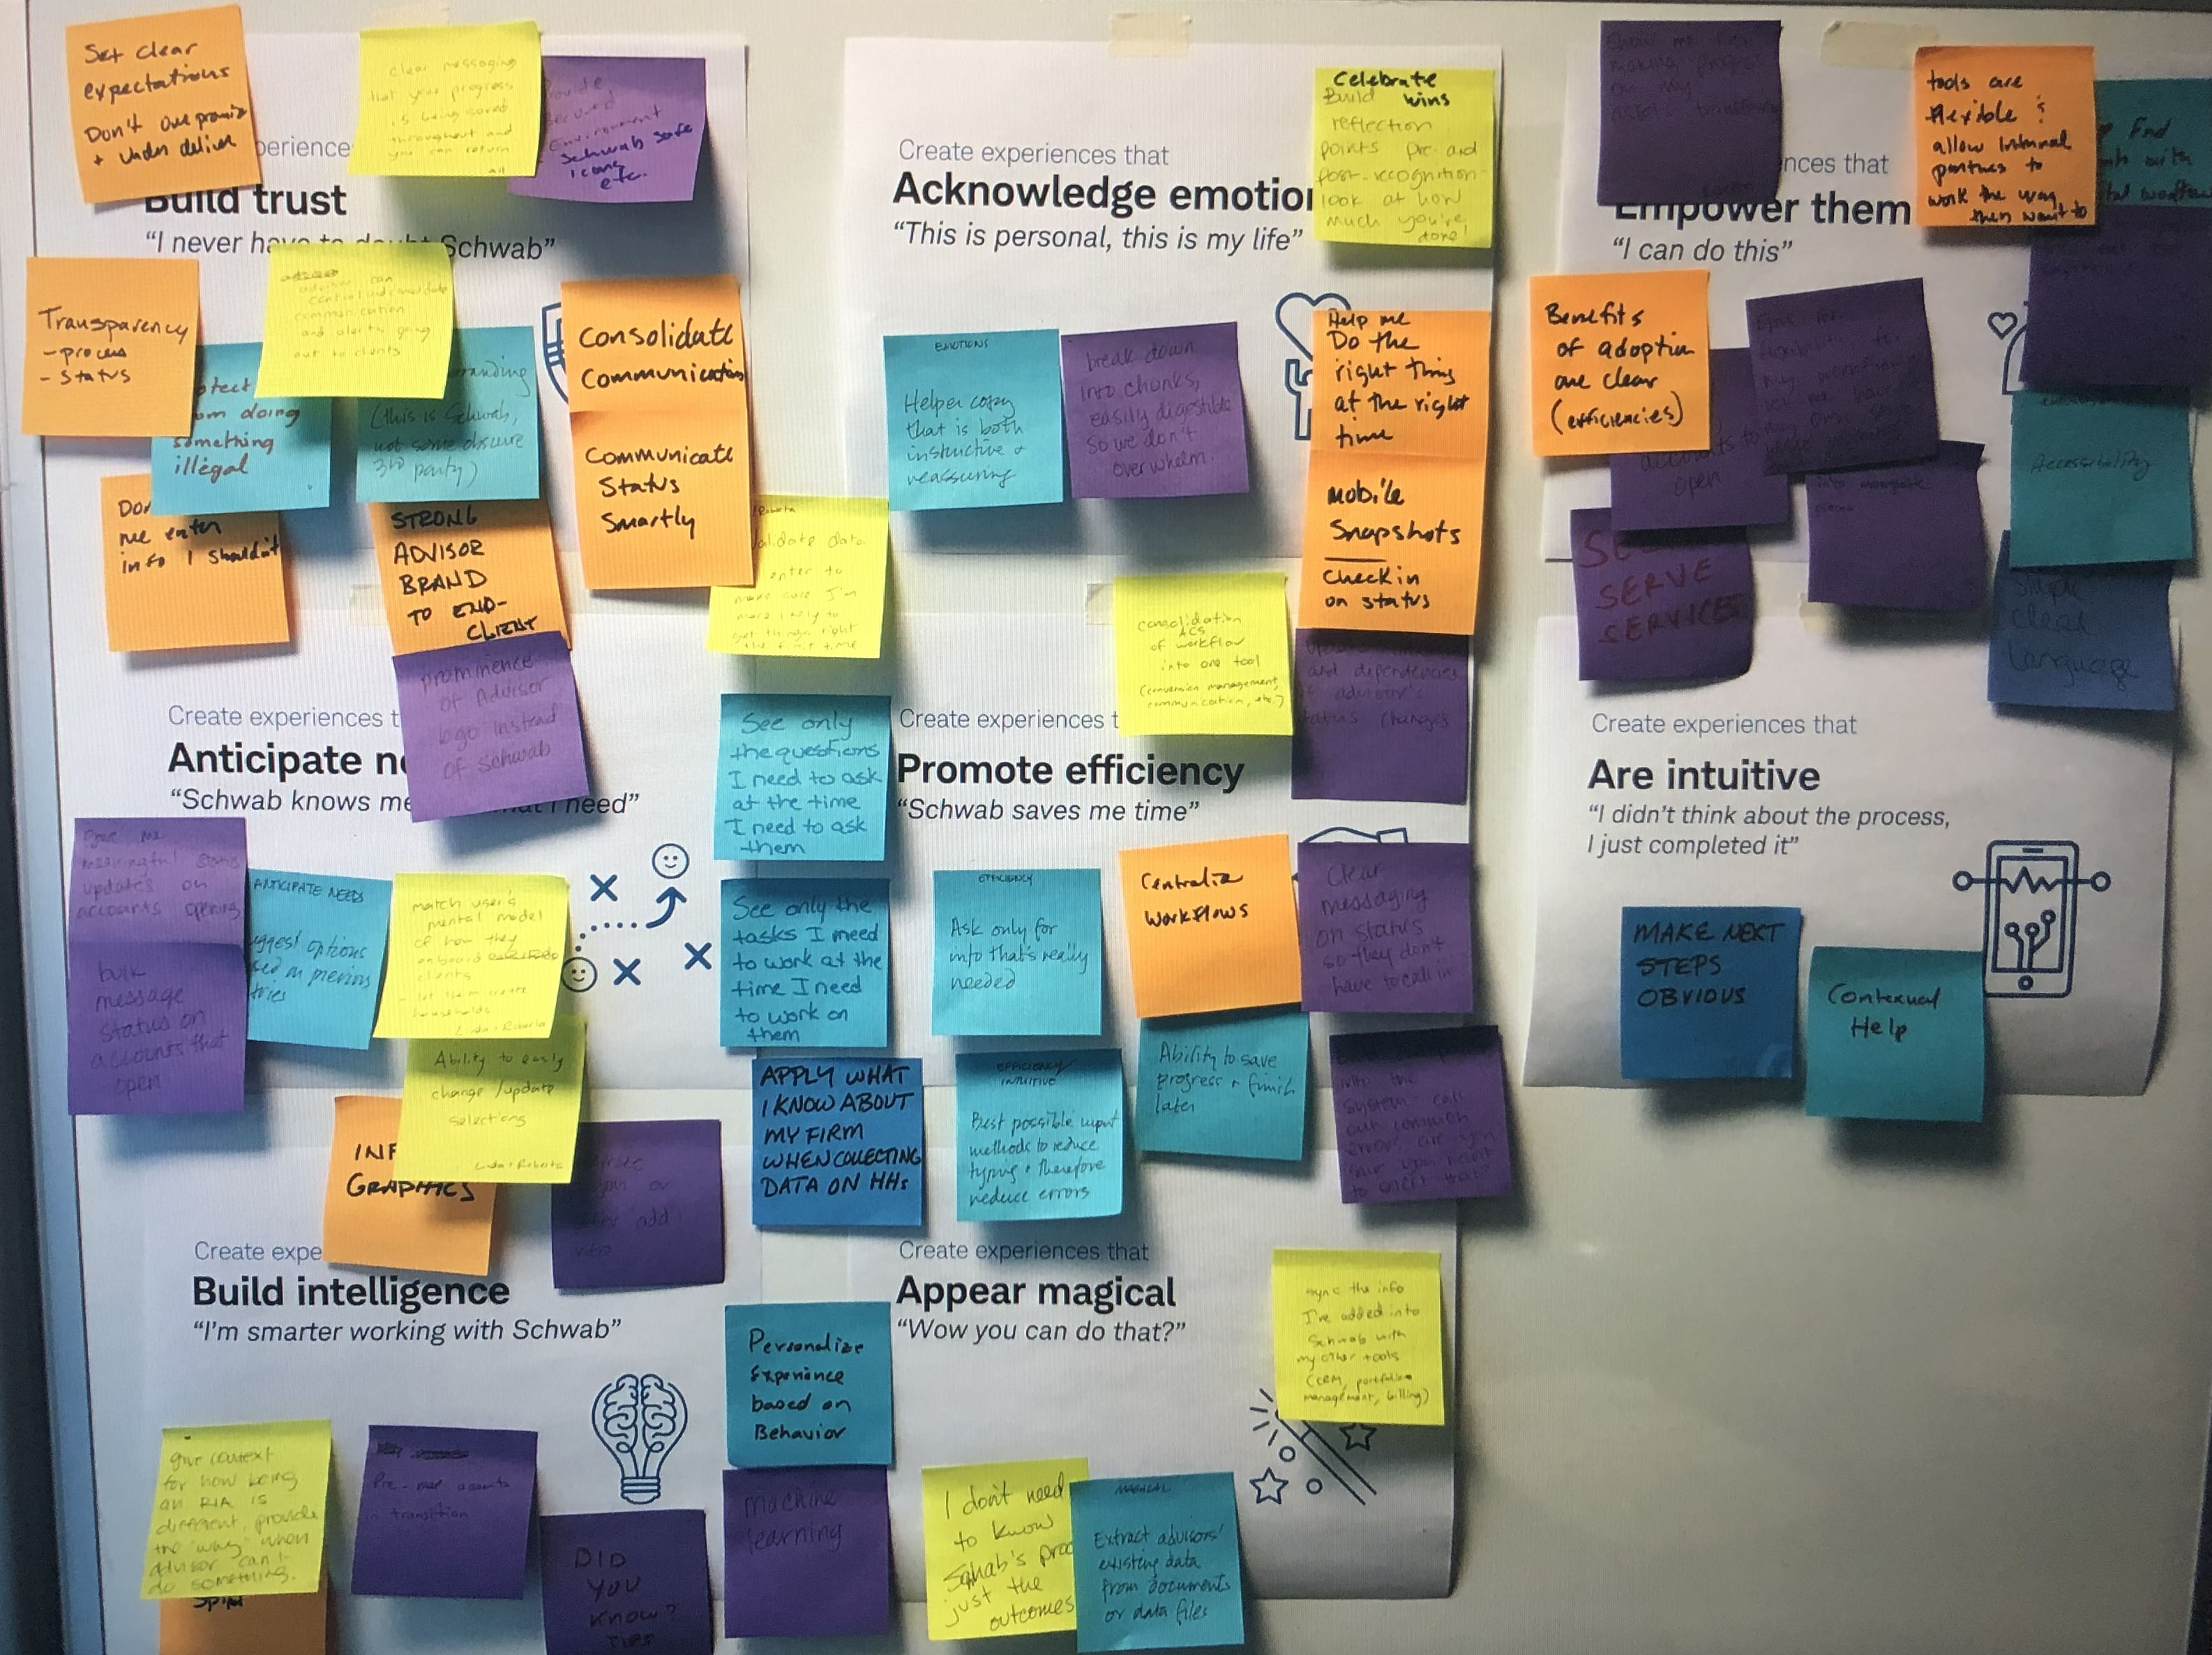
The breakthrough came during synthesis. We covered a wall with sticky notes— not features, but feelings. What should Roberta feel at each stage?
- "I can do this." Empowerment over overwhelm.
- "Schwab knows me." Anticipation over interrogation.
- "I didn't think about the process." Intuition over instruction.
- "This is personal." Acknowledgment over automation.
These weren't platitudes. They became design constraints. Every screen, every interaction, every error message was measured against them.
Mapping the Chaos
The existing system wasn't one system—it was a tangle of handoffs between three different user types: internal consultants managing the relationship, prospective advisers gathering information, and advisers actively in transition moving client assets.
Each had different needs, different timelines, different anxiety levels. The consultant needed visibility across dozens of transitions. The prospect needed to understand what they were signing up for. The adviser in transition needed to track hundreds of client accounts without dropping any.
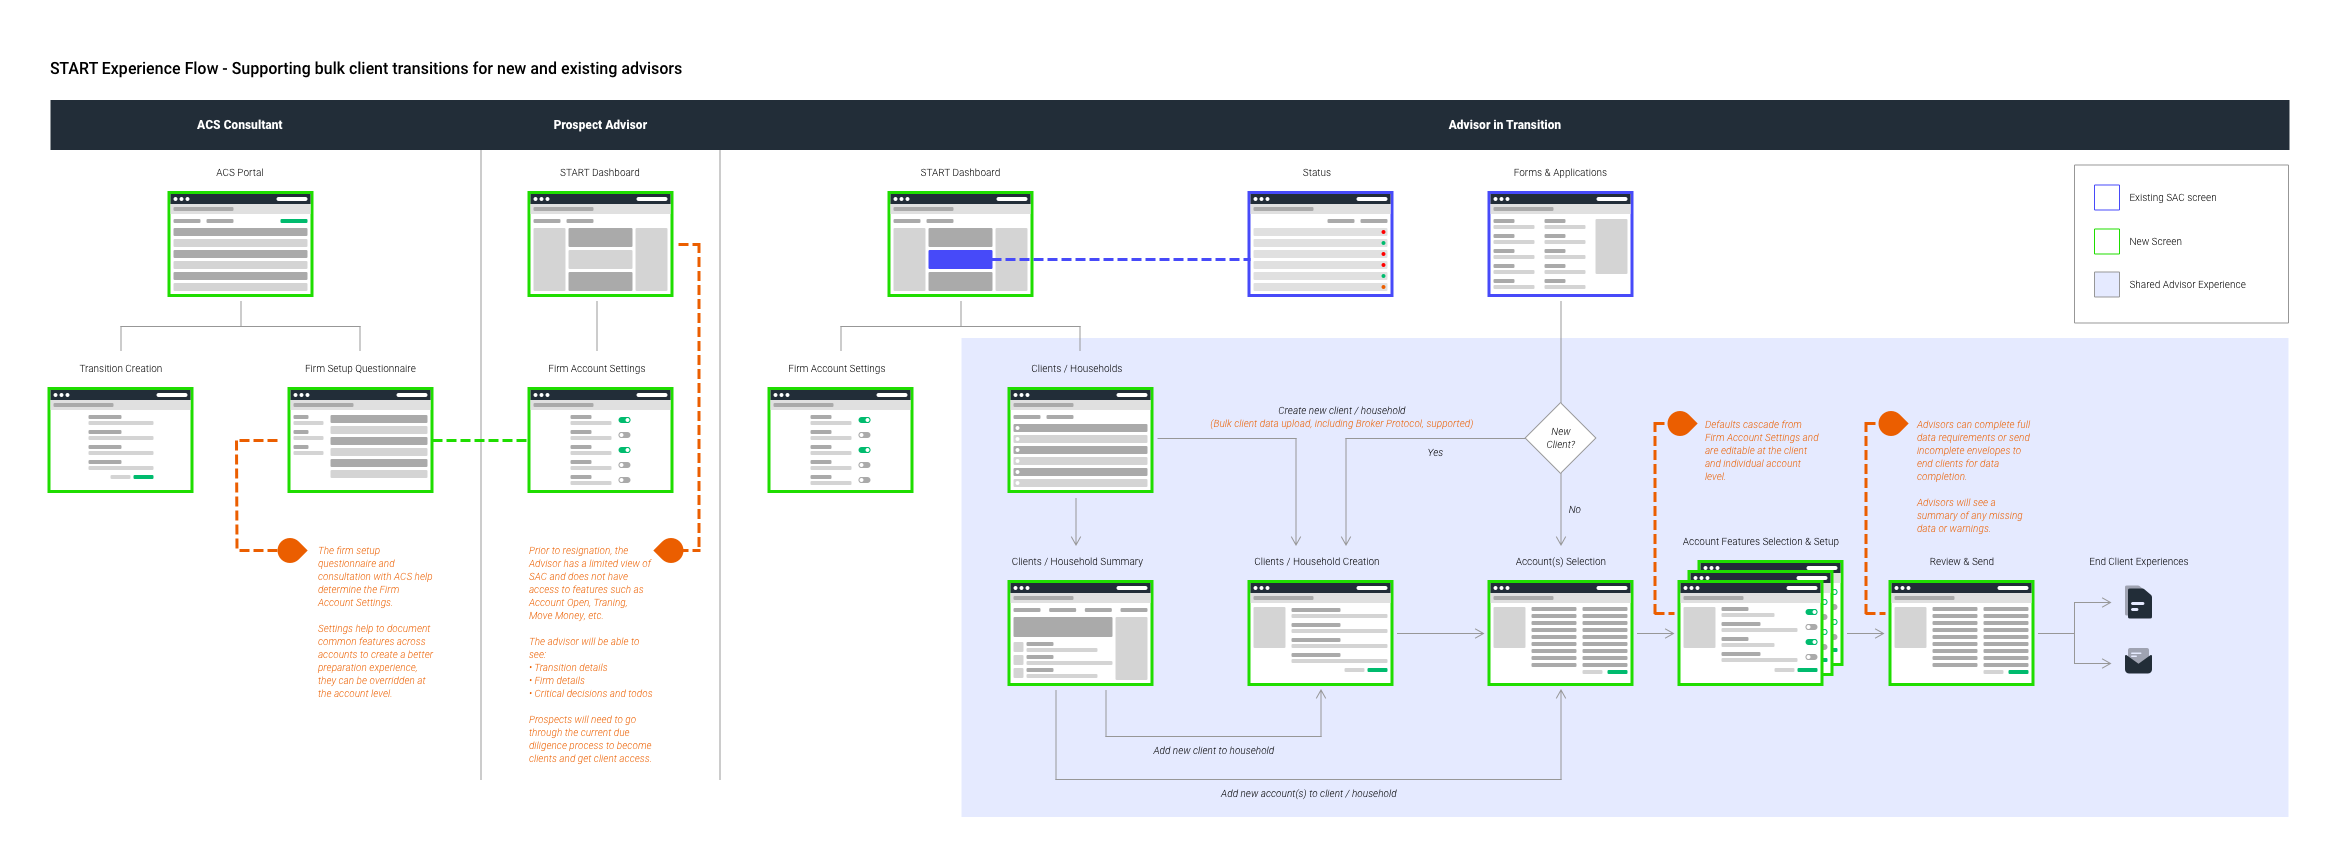
Mapping this flow took weeks. We discovered that advisers were often working with incomplete information, guessing at regulatory requirements, and re-entering the same client data into four different systems. Errors didn't surface until weeks later, when compliance finally reviewed the submission.
The insight: stop catching errors at the end. Prevent them at the source.
Designing Together
We ran weekly testing cycles with real advisers. Not polished prototypes— paper sketches, hand-drawn wireframes, rough concepts that invited critique. The goal wasn't validation. It was collaboration.
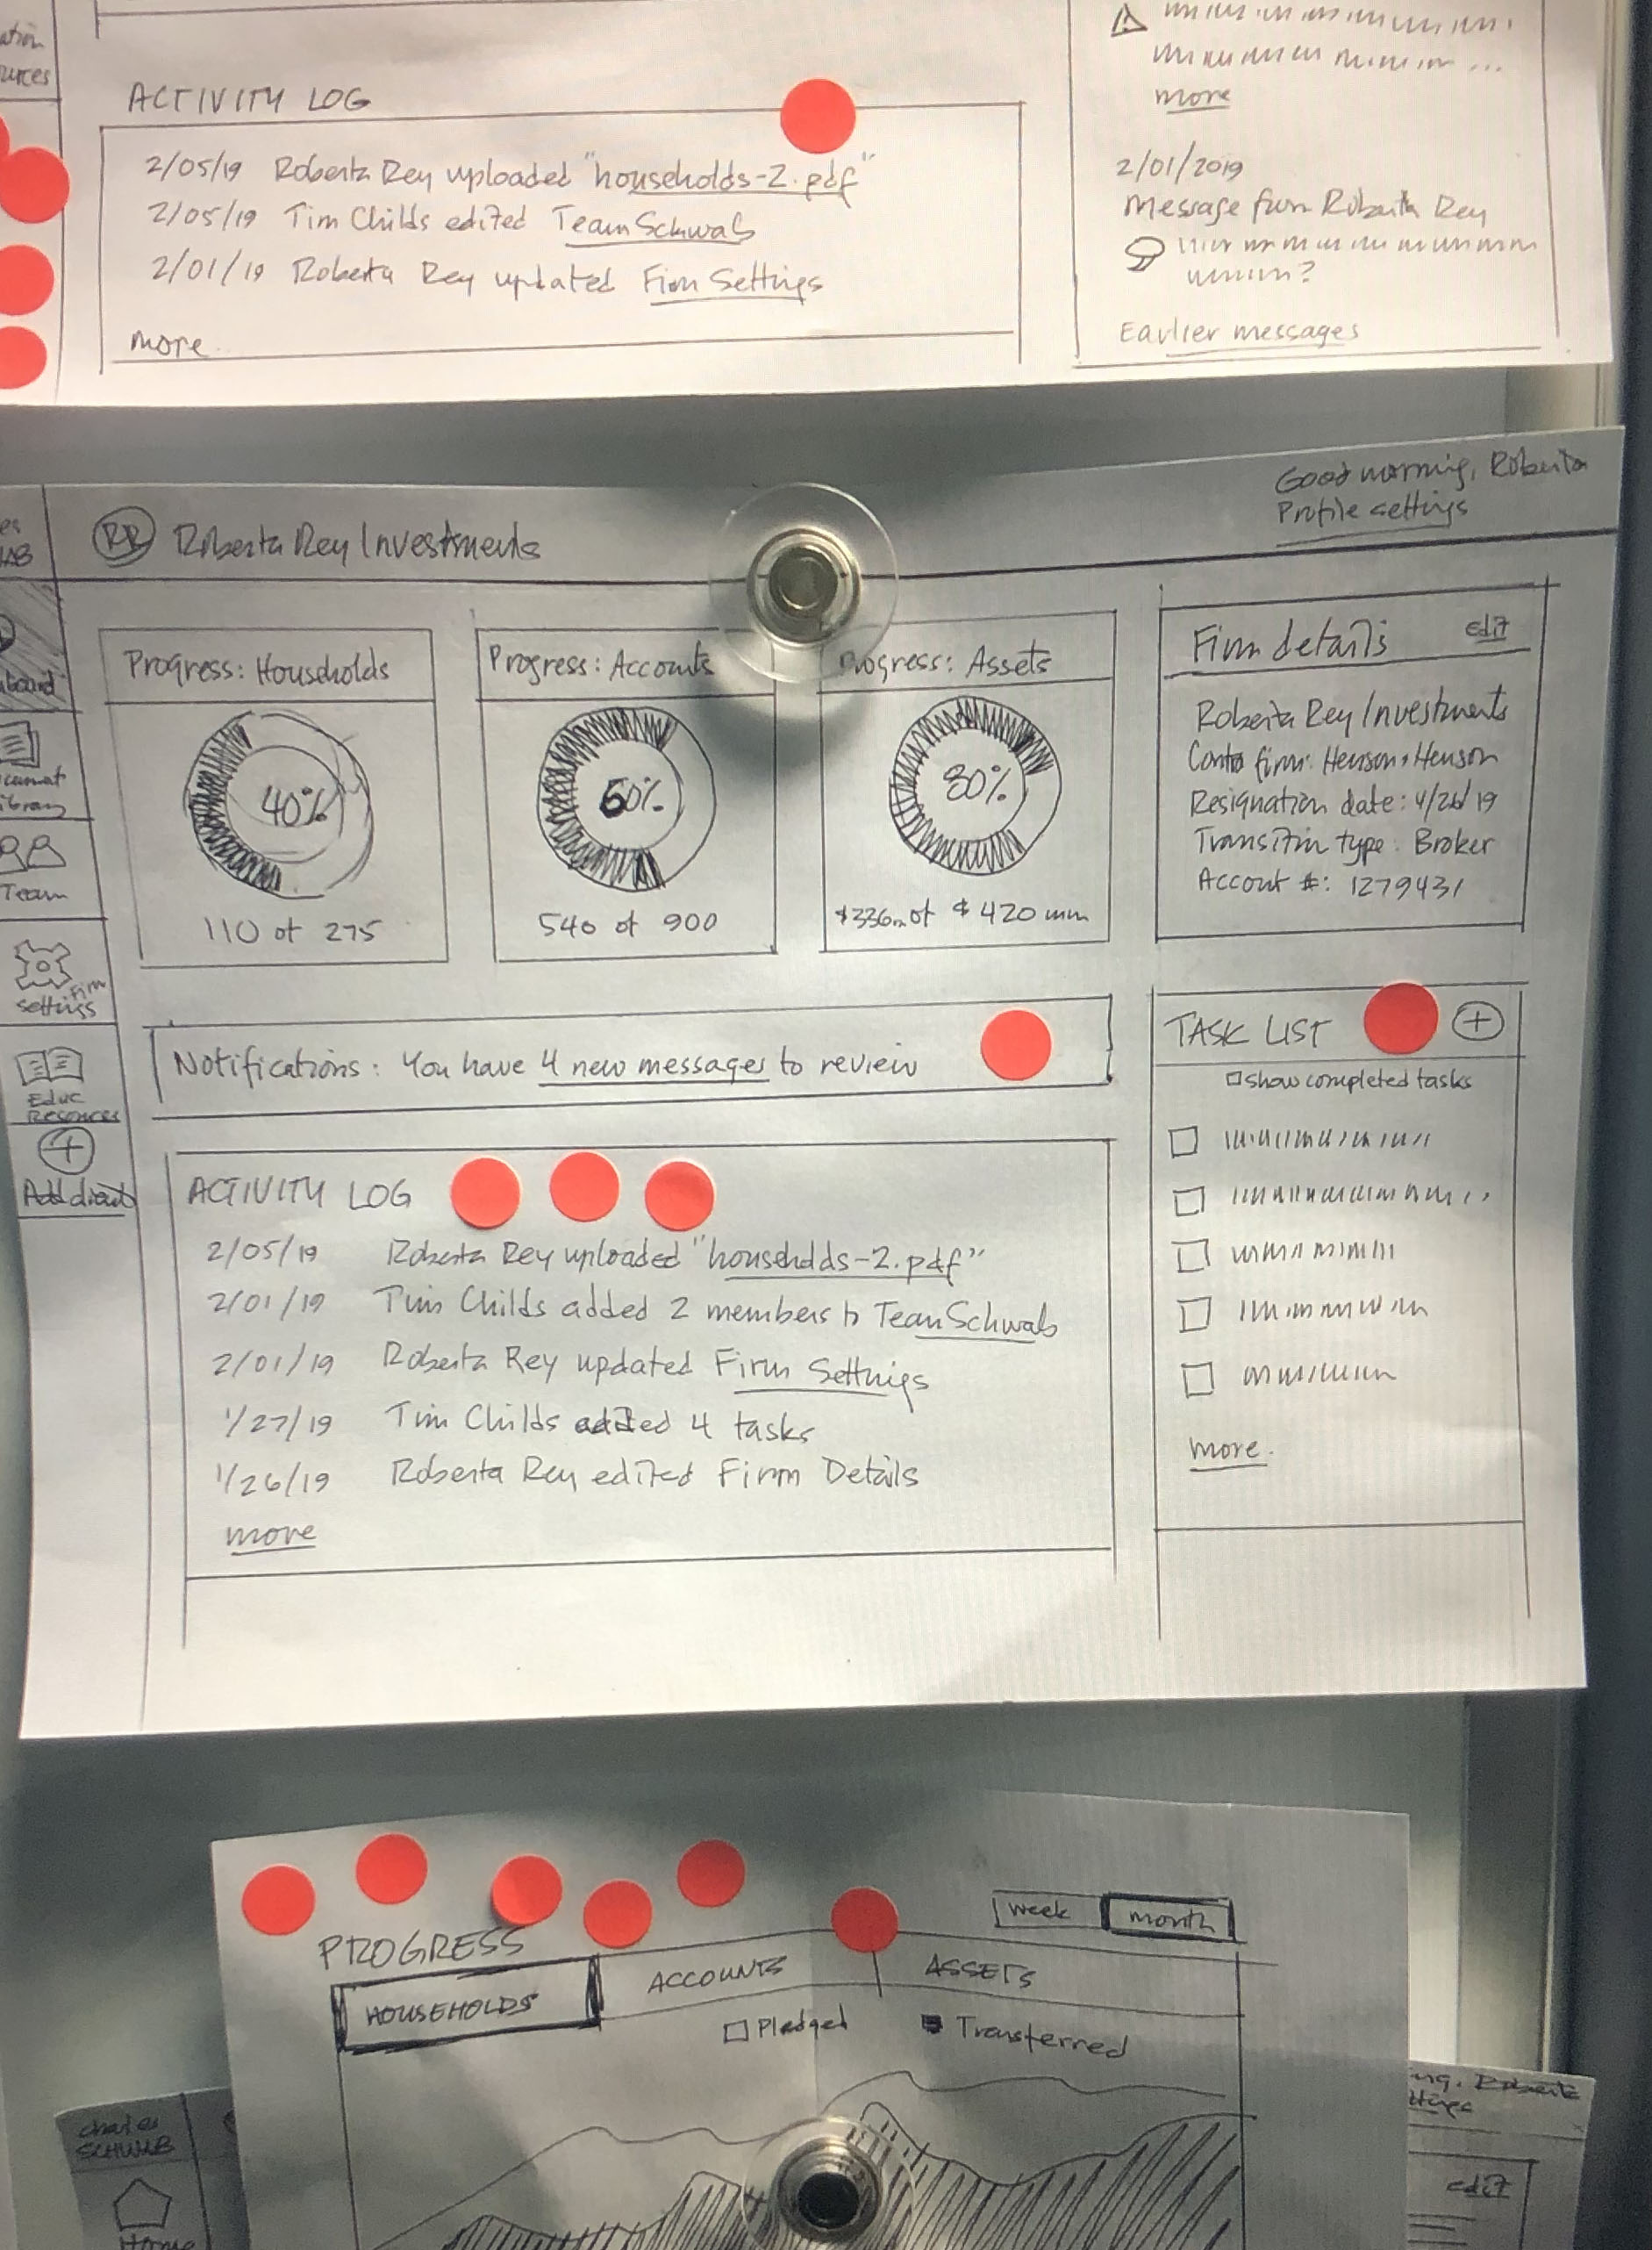
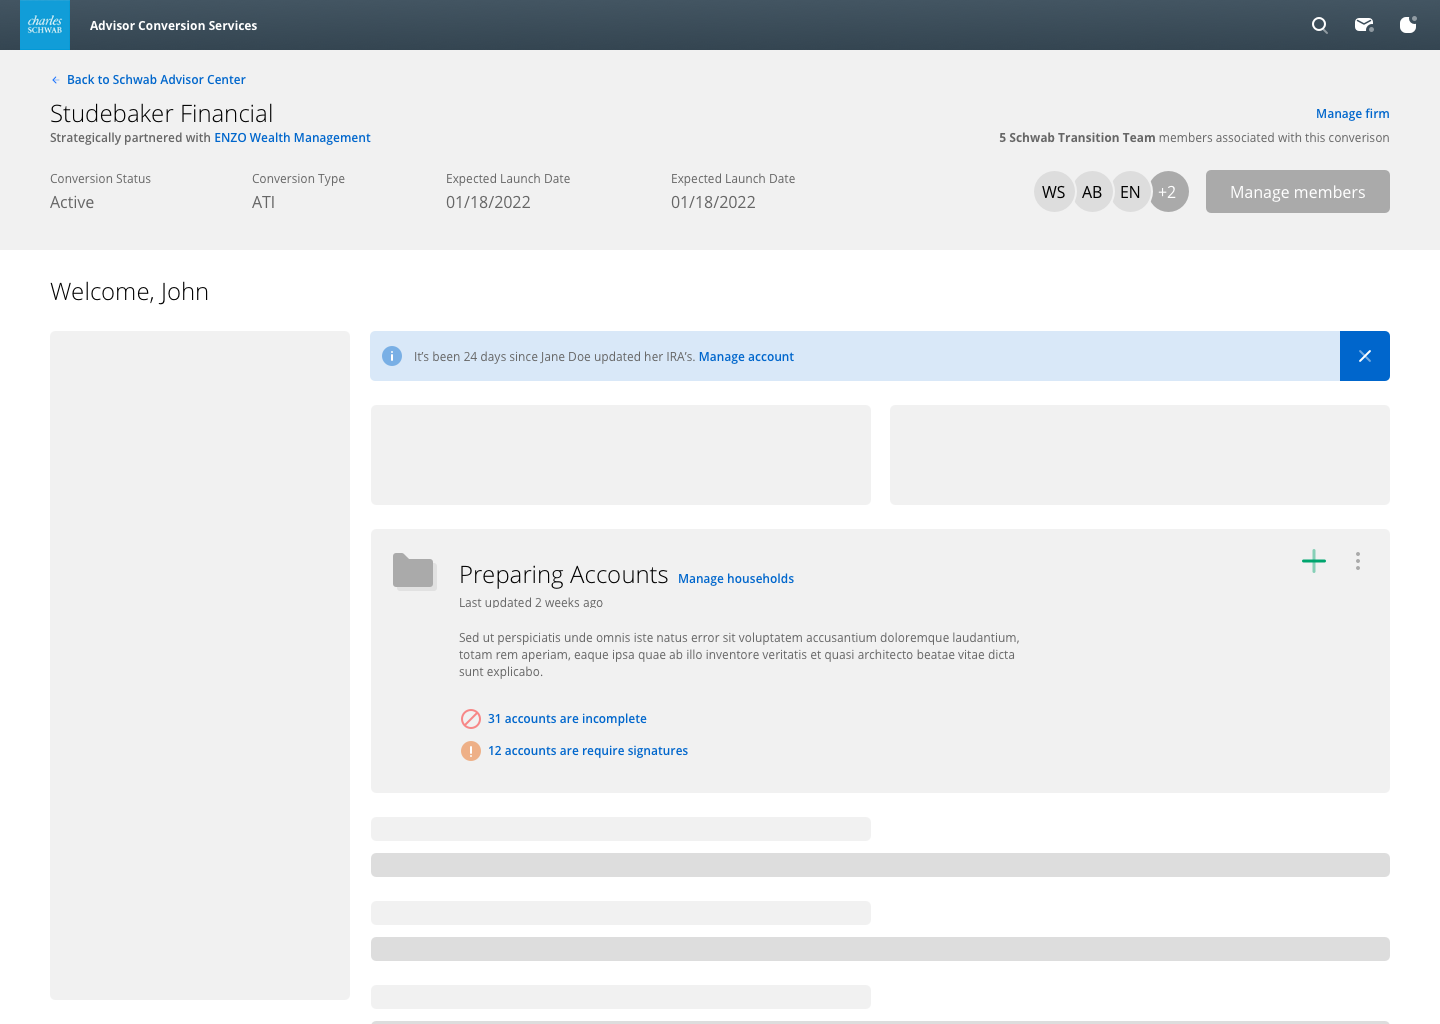
The dashboard wireframe went through 23 iterations. Each one taught us something. The progress indicators needed to show momentum, not just completion. The activity log needed to surface what mattered, not just what happened. The task list needed to prevent mistakes, not just track them.
We landed on a design that felt less like a form and more like a co-pilot. The system didn't just accept input—it anticipated needs, flagged risks before they became rejections, and gave advisers confidence that nothing was falling through the cracks.
The Transformation
Not In Good Order rates dropped from 74% to 18.3%. Average transition time fell from 94 days to 37. The platform projected $11.2 million in recovered revenue and $1.35 million in operational savings within the first year.
But the number I remember isn't in any report. It's from a call with an adviser who had just completed her transition. She said: "For the first time, I felt like I was in control."
That's what we designed for. Not efficiency—agency. Not speed—confidence. Not compliance—partnership.
The paper trail became a data stream. And Roberta could finally focus on what she did best: taking care of her clients.